
Box Office Analysis

For a more detailed analysis, check out the full repo on Github. You can even copy the notebook and run the code yourself.
Project Goal
My project aims to assist Microsoft in starting a movie studio. Through exploratory data analysis, I will offer insight to the head of the Microsoft movie studio on what movies are likely to be most successful. The measurement for success will be gross revenue, and I will examine key features such as production budget, genre, and director.
Using the data I provide, the head of the Microsoft studio will be able to make more informed decisions regarding what kind of movies the studio should focus on making.
The Data
Data Sources
The data comes from three movie websites:
- IMDB: a SQLite database containing movies from 2010 to present. The main metrics I will be focusing on are genre and director.
- Box Office Mojo: a csv file with the domestic and foreign gross of movies from 2010 to 2018.
- The Numbers: a csv file containing the domestic gross, worldwide gross, and production budget of movies from 1915 to 2020.
Data Selection
Given the data that is available from these 3 sources, I decided to focus only on movies from 2010 to 2018. These are the years for which the revenue and budget data is included.
Data Limitations
The data does not include the most recent movie releases (2018-present). This would normally be a drawback, but given the ongoing global pandemic, which greatly shifted the movie and movie theater industry, the lack of recent data means that the analysis won’t be skewed by the unprecedented changes that occured in recent years.
The other major limitation of the data is that it does not include information on movies released through streaming services. Given that the project goal is focused on helping Microsoft start a traditional movie studio, this won’t be an issue. But ideally, any attempt by Microsoft to get into movie production would need to be informed by the recent rise of streaming platforms and direct-to-streaming movie releases.
Data Analysis
After cleaning and preparing the data, there were 1,271 movies available to analyze. The analysis discovered three key features for determining a movies worldwide gross revenue: production budget, genre, and director.
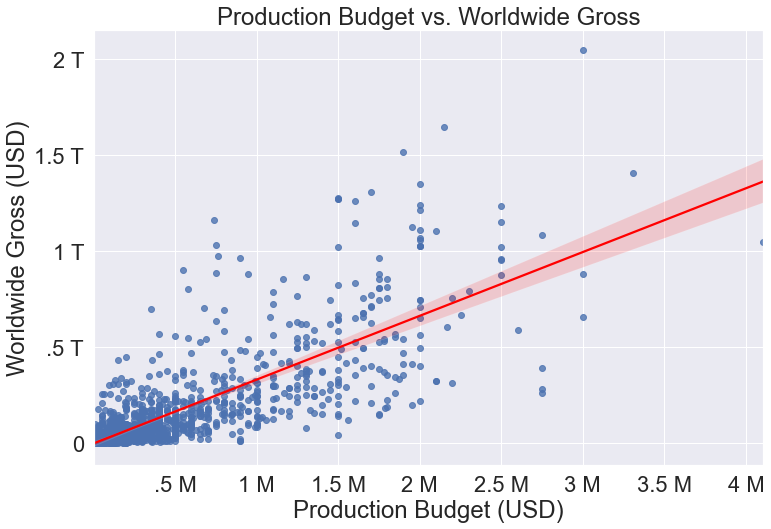
Production Budget: This graph shows the linear correlation between production budget and worldwide gross revenue. Production Budget was the highest correlated feature with a correlation of .774.
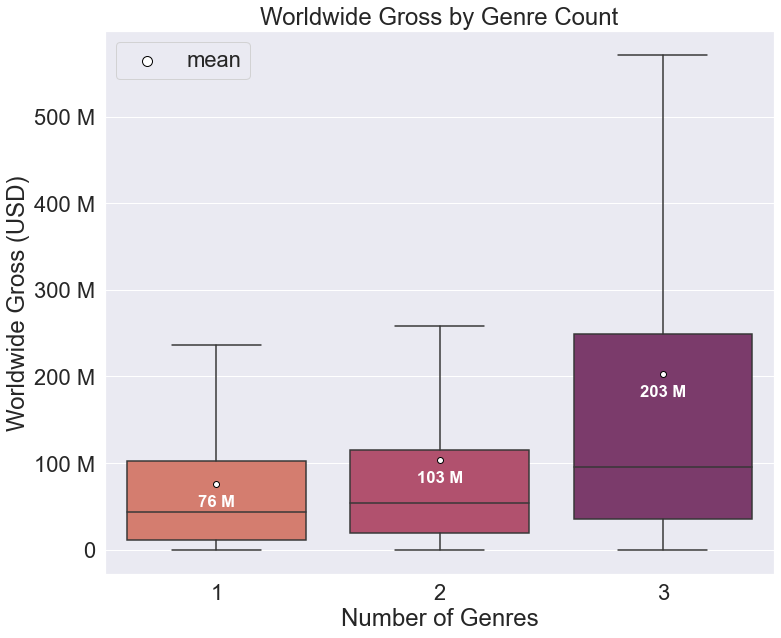
Genre: Genre analysis focused on three compnents: the number of genres per movie, the performance of individual genres, and the best genre pairings. The genre data comes from IMDB, which limits a movie to a maximum of 3 genres. This box-and-whisker plot shows the relationship between number of genres and worldwide gross revenue. Outliers have been removed for readability, with the mean included to demonstrate the relative weight of the missing outliers.
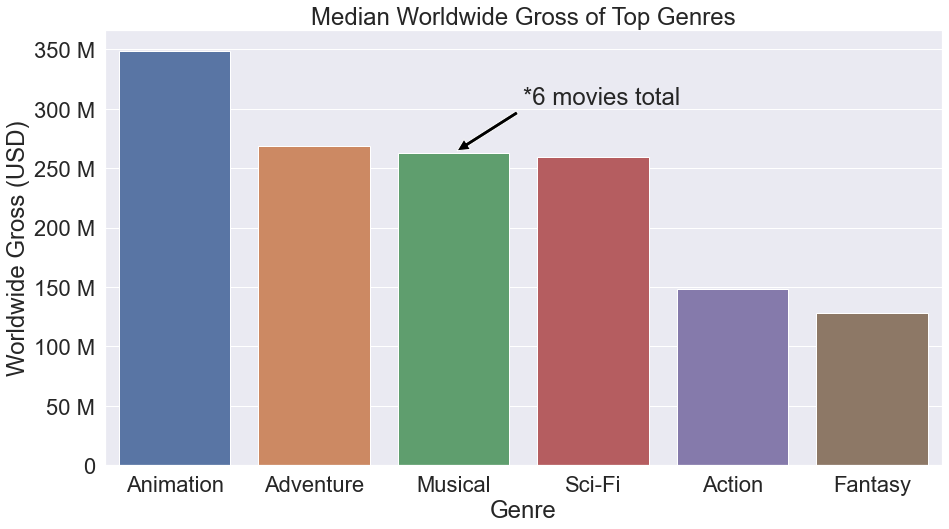
Next was the analysis of individual genres. There was a high degree of variance among the top-performing genres, suggesting that the specific genre is less important than having multiple genres.
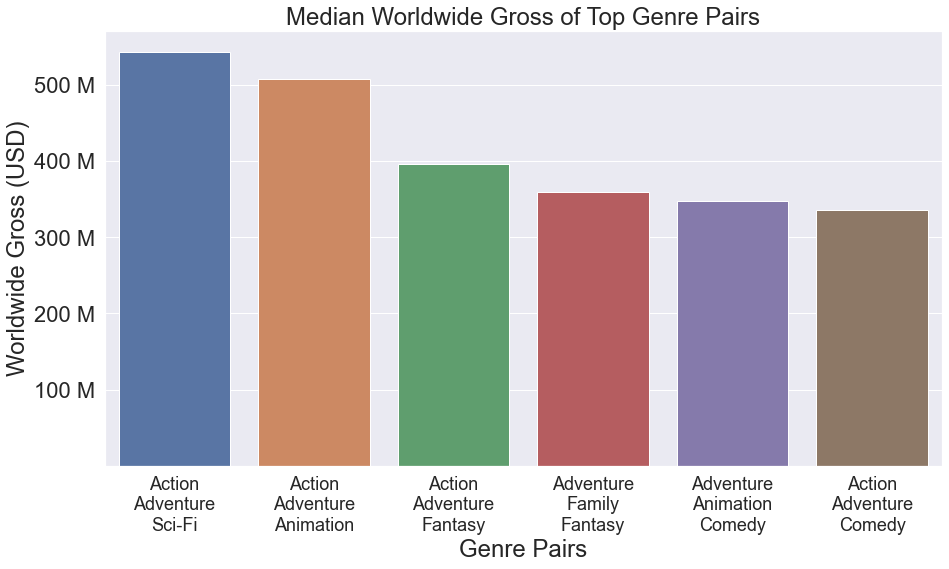
Last was identifying the top genre pairings among movies with 3 genres. All 6 of the top pairings included Adventure, and 4 included Action, suggesting that the best pairing is Action-Adventure plus one additional top genre.
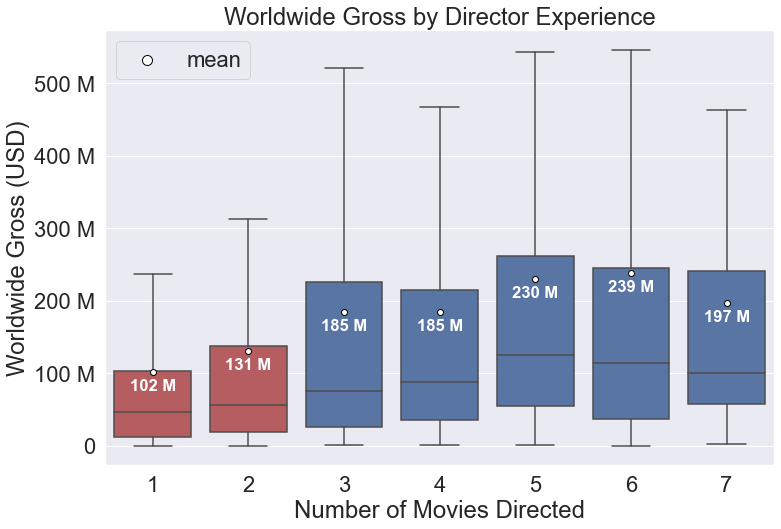
Director: This box-and-whisker plot shows the worldwide gross revenue of movies by directors grouped by the total number of movies they have directed as of the date of data collection. The data suggests that directors with a minimum of 3 movies directed perform better than those with 2 or less movies directed.
Results:
In conclusion, the data suggests that in order to earn a higher gross revenue, Microsoft Movie Studios should focus on movies with:
- higher production budgets
- broad appeal (multiple genres)
- proven directors with past box office success (2-6 previous movies directed)
Production Budget:
Production budget had the highest correlation to gross revenue of all available features (r=.774). This correlation is not strong enough to be used as a stand-alone metric, but it does provide some insight. In general, movies with a higher production budget earn a higher gross revenue.
Genre:
For the genre analysis, I examined total genre count, individual genre performance, and best genre pairings.
For genre count, the data showed a much higher mean and median gross revenue for movies with at least 3 genres. This suggests that movies with a broader appeal and a bigger reach will earn significantly more revenue than movies with a more narrow focus.
When examining individual genres, there was a great deal of overlap between the genres with the highest production budgets and gross revenues. The genres with the highest median gross revenue were, in order: Animation, Adventure, Musical, Sci-Fi, Action, Fantasy. However, the variance and number of data points for each genre was highly inconsistent. In particular, Musical only consisted of 6 movies. This indicates that the data is either unreliable, or that the genre is undersaturated in the current market, which is something that could be capitalized on.
Examining the top genre combinations revealed that among movies with 3 genres, Action and Adventure were the 2 highest represented genres. These genres, when paired with another top genre such as Sci-Fi, Animation, or Comedy, outperformed all other combinations.
Director:
Directorial experience was defined by the total number of movies a director had directed at the time of data collection. When examining the relationship between directorial experience and gross revenue, the data was ultimately inconclusive. It does demonstrate a general overall increase in average gross revenue as the number of movies directed increases, but there is also a lot of overlap in the graph. The data does suggest, though, that a director with between 3-7 movies directed does have a much better chance at creating a movie with a higher gross revenue than a director with 1-2 movies directed.
Next Steps:
There were several limitations and shortcomings that would need to be rectified in future analysis:
The dataset does not include data from the most recent years. However, due to the ongoing global pandemic, and the resulting industry upheaval, this could mean the data is more consistent with a typical box office environment.
The dataset does not include financial information on movies released on streaming services. This data is hard to come by, as the revenue structure is very different and much of the specific information is not publicly available. But given the rise of streaming services in the movie industry, it is something that Microsoft needs to consider.
The dataset does not include consistent data on revenue and production budget, which limited the number of movies that could be analyzed. Ideally, more data collection should be done to improve the accuracy of the data.
Directorial analysis only considered the total number of movies directed at the time of data collection. Ideally, the analysis should include data on the number of movies a director had made prior to the release of each specific movie, as well as analysis on the likelihood of a director’s financial success based on the performance of their past movies, but this would also require a great deal more data collection and preparation.
In addition, directorial analysis should include verifying that a directors previous experience matches the other recommended criteria: higher production budgets and movies with broad appeal that fit the correct genre pairings.