
Jacksonville Housing Prices Time Series Analysis

For a more detailed analysis, check out the full repo here: Github You can even copy the notebook and run the code yourself.
Project Goal
The goal of this project is to use time series data from Zillow to forecast home prices in Jacksonville, Fl. I take the role of an analyst for a real estate consulting agency. The agency specializes in helping clients relocate in a relatively short time frame. The current client I am working with is a contractor who just agreed to a 2-year contract with a company based in Jacksonville, Fl.
The contract starts in 3 months, so the client would like to be in their new home by that time. They have a budget of $275,000. Additionally, there is a chance that they will be relocating again at the end of the current contract, so they would like to buy a home that will offer the best ROI if they need to sell it in 2 years time. My job is to help narrow the search by identifying zip codes in the Jacksonville area that meet the clients criteria. Once this is done, the client can make an informed choice while considering other options (commute time, neighborhood, convenience, etc.).
Understanding the Data
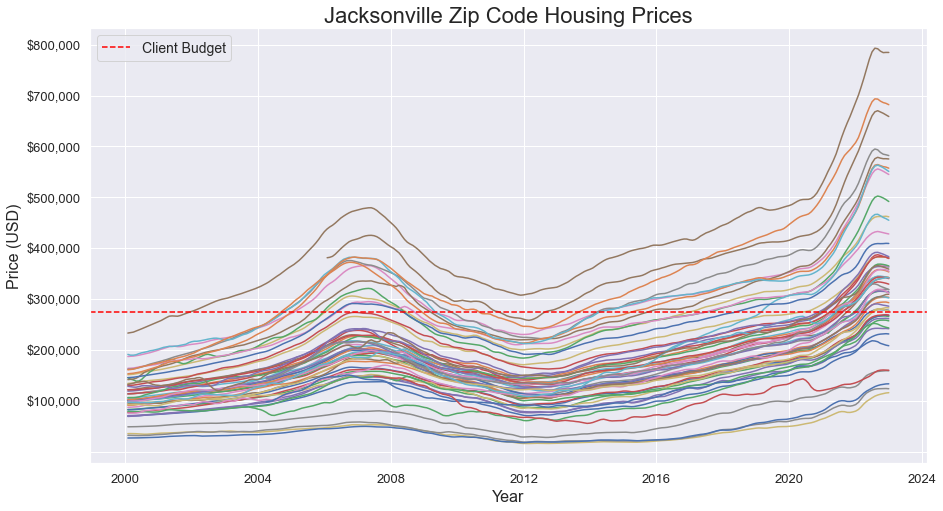
The main dataset is a collection of monthly median housing prices from Zillow dating back to 1996 and grouped by zip code. The data has been smoothed and the seasonality has been removed. I trimmed the data to only include the 56 zip codes in the Jacksonville Metropolitan area. After accounting for the client’s budget, I was left with 14 zip codes.
I chose to remove the data prior to 2012. This is because this timeframe best captures the current state of the housing market. Prior to 2012, the housing market was tumultous due to the global financial crisis and housing bubble in 2008.
In the Appendix, I use additional seasonal data from Zillow to demonstrate how a more nuanced analysis could be performed. Unfortunately, most of the seasonal data only goes back to 2018 and is not available by zip code, but it still offers some insight when forecasting future house prices.
Exploratory Data Analysis
After preparing the data, it was ready to be visualized and modeled. Below is the median house price for each zip code in the Jacksonville area.
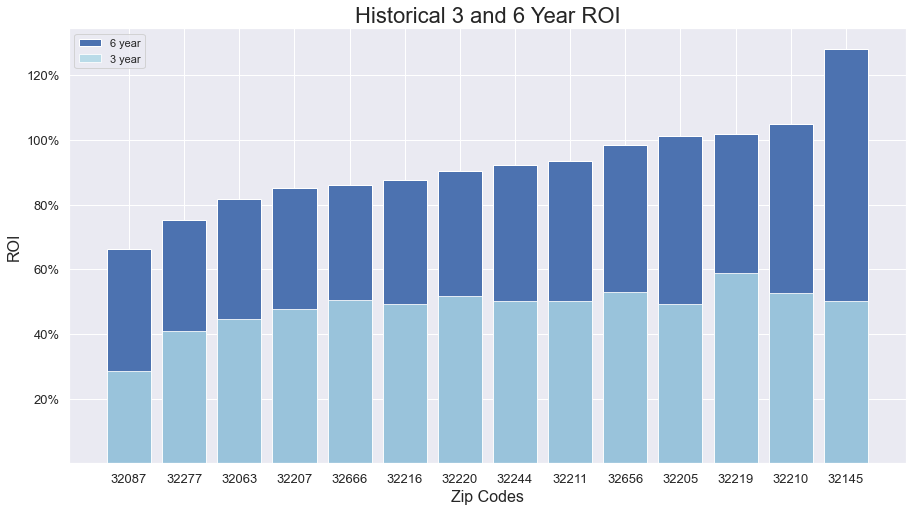
After a more detailed discussion with the client regarding their budget range, I limited the analysis to only include the 14 zip codes with a current price between $200,000 and $300,000. I then calculated the past 3-year and 6-year ROI for each zip code:
Time Series Modeling
When creating models, I used AIC to determine the best model.
After examining the data, I decided to create a train-test split of 80-20. This was a key decision because of the difference in price growth between the two splits, which can be seen here:
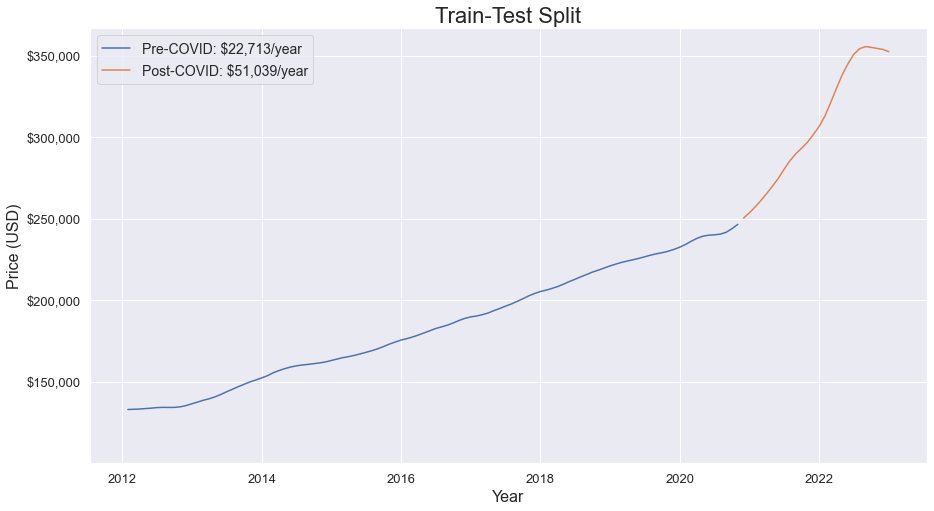
Starting around 2021, the housing prices begin to increase at a much faster rate before flattening out in the last few months. There are several factors for this, but the biggest one is the effect of the COVID pandemic and the resulting economic policies, such as a drastic and long lasting reduction in the interest rate, which contributed to a rapid rise in house prices.
By training a model on pre-pandemic data, it is almost guaranteed to struggle at accounting for the change in price growth in the test set. Ultimately, I have decided to still create a model based on the training set because I believe that data is more indicative of the long term housing price growth, and as I demonstrate in the Appendix, it appears that the market is undergoing a correction that will likely return it to pre-pandemic levels.
I used the average median house price data from all Jacksonville zip codes to train and test an initial model. I used auto-arima to find the best parameters, and used AIC to select the best model, which made the following predictions:
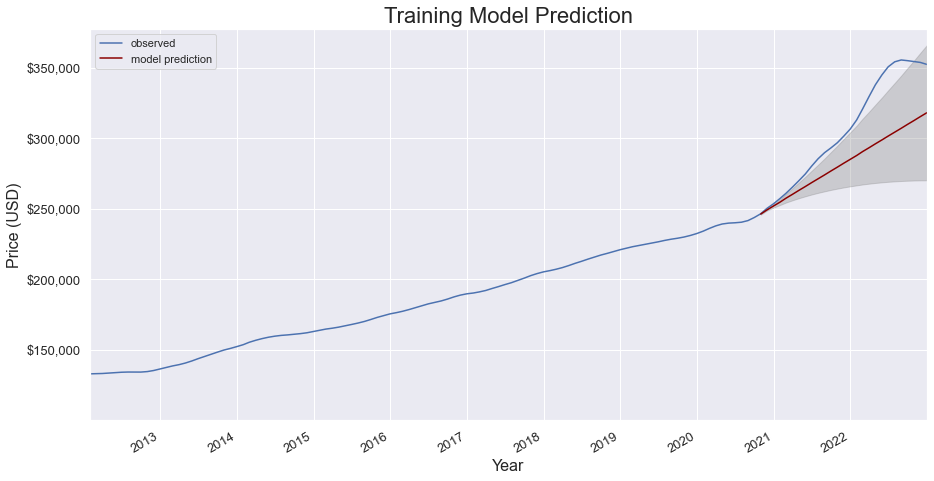
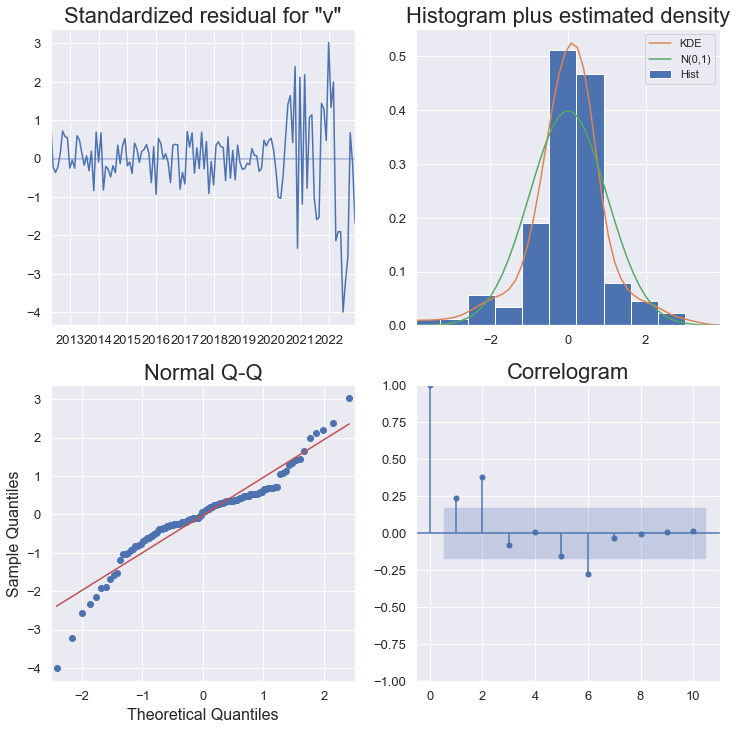
As expected, it was unable to anticipate the increase in price growth in the test set. However, I used the same parameters when training a model on the entire dataset for the reasons mentioned above. The diagnostics of the model trained on the entire set are shown below, and display the expected issues of an increase in residuals at the tail end, and deviation in the QQ-plot and correlogram:
I then found the best model for each individual zipcode and made 2-year forecasts on housing prices. The forecast for the average of all Jacksonville zip codes looks like this:
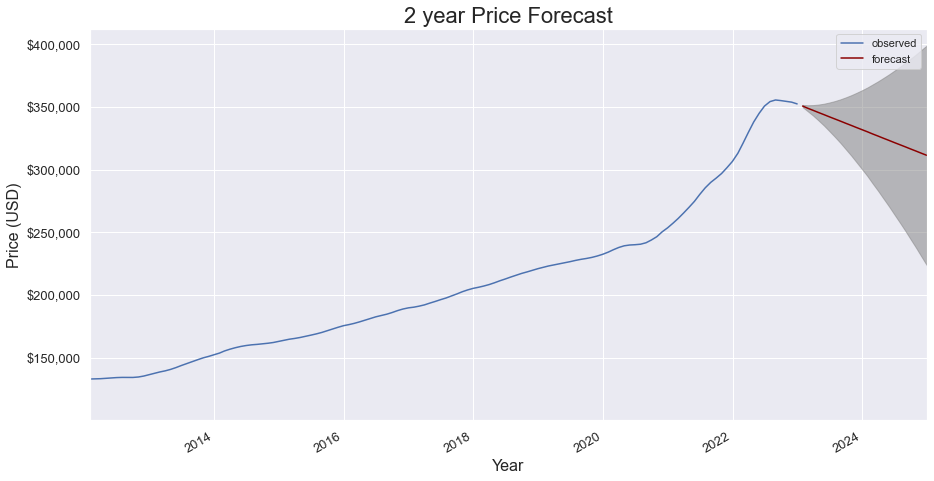
The above forecast is indicative of the forecasts for each individual zip code. In fact, every model predicted a drop in price over the next 2 years. However, the model confidence is low, as indicated by the size of the dark grey section.
Results and Recommendations
These are the top 5 zip codes by ROI:
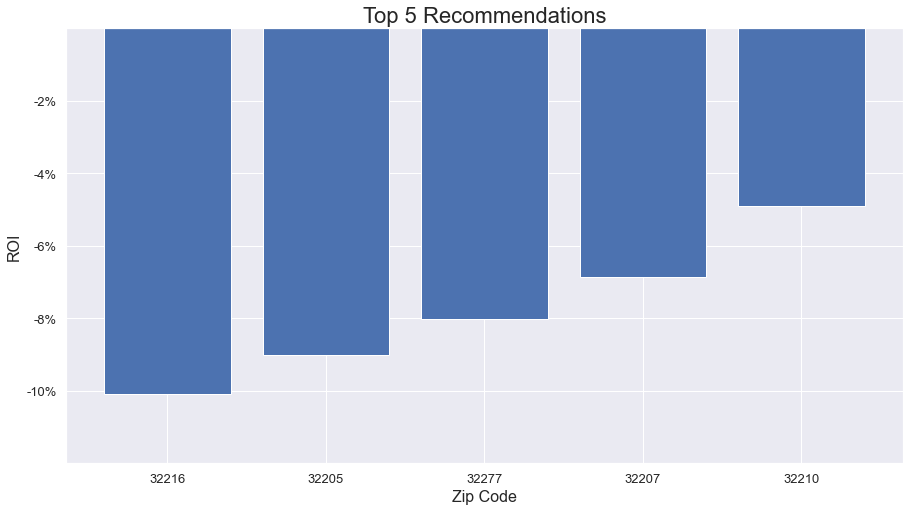
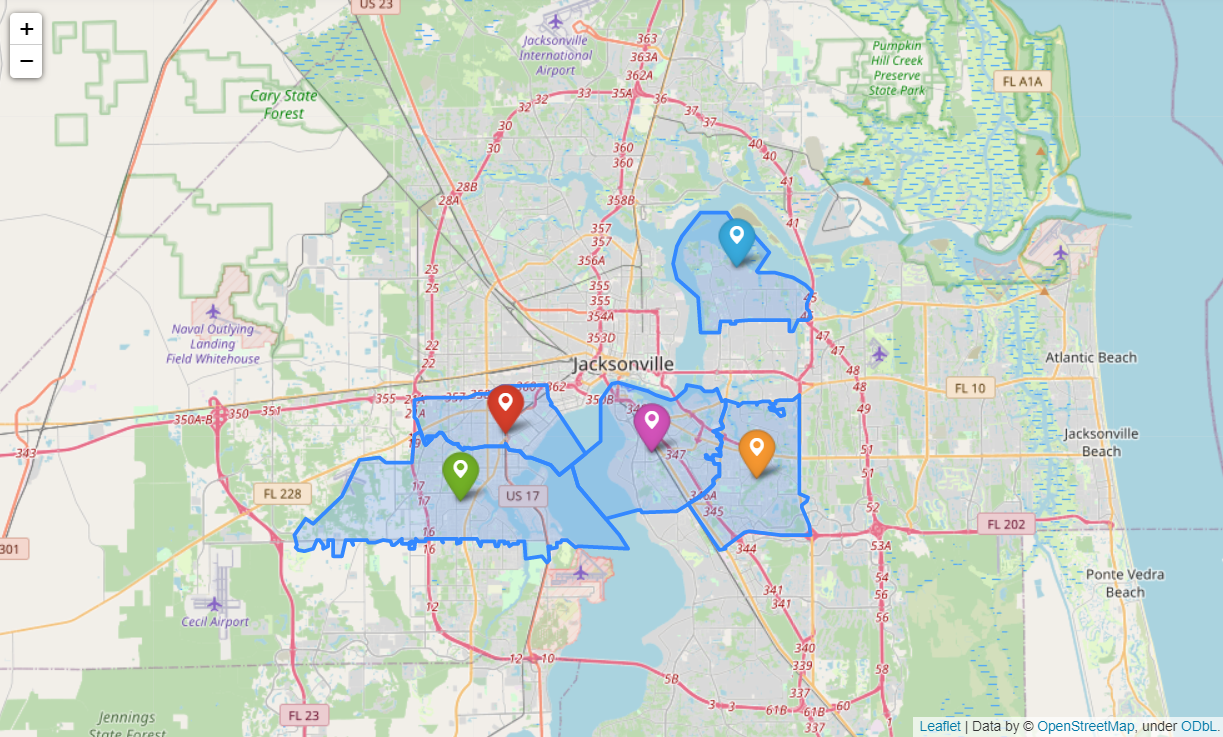
These 5 zip codes are predicted to retain the most value over the next 2 years. While it is unfortunate for the client that no zip codes are expected to increase in price overall, in the Appendix I look at some additional data that suggests prices could begin rising again within the 2-year window. I have also been plotted the top 5 zip codes on the map below:
Appendix
I examine some additional seasonal data from Zillow as well as the historical interest rate in the US as set by the Federal Reserve. The data reinforces that the housing market was undergoing an unusual growth phase between 2020 and late 2022, and appears to be heading for a dip as 2023 begins. For a detailed look, see the jupyter notebook on GitHub.
The difficult part is anticipating when a recovery might occur. With the Federal Reserve publicly stating their intent to continue increasing interest rates through 2023, it is likely that house prices will continue to drop, but it is possible the market could rebound in 2024. Ultimately, the extra seasonal data was not enough to provide any definite conclusions, but it does help provide additional context to help inform the forecasts on the main dataset.